PQSCADA Sapphire, offers a single and unified experience across all data sources and with all power quality devices, providing a full functionality and a faster performance for data exploration, analysis and visualization. PQSCADA Sapphire is an open, fully programmable platform designed for customization, and ease of integration. With an open and flexible platform, PQSCADA Sapphire supports many levels of customization: from simple end user configurations to XAML styling and full coding.
Software for analyzing recorded quality parameters - PQScada Sapphire offers unique experience with all sources of data and with all devices for recording electrical quality parameters. It provides full functionality and quick access to research, analysis and visualization of recorded data. PQScada Sapphire is an open and fully programmable platform, designed for tuning and easy integration with a variety of measuring devices. With an open and flexible platform, PQScada Sapphire supports a lot of adjustments: from simple user configurations to XAML style and full encoding.
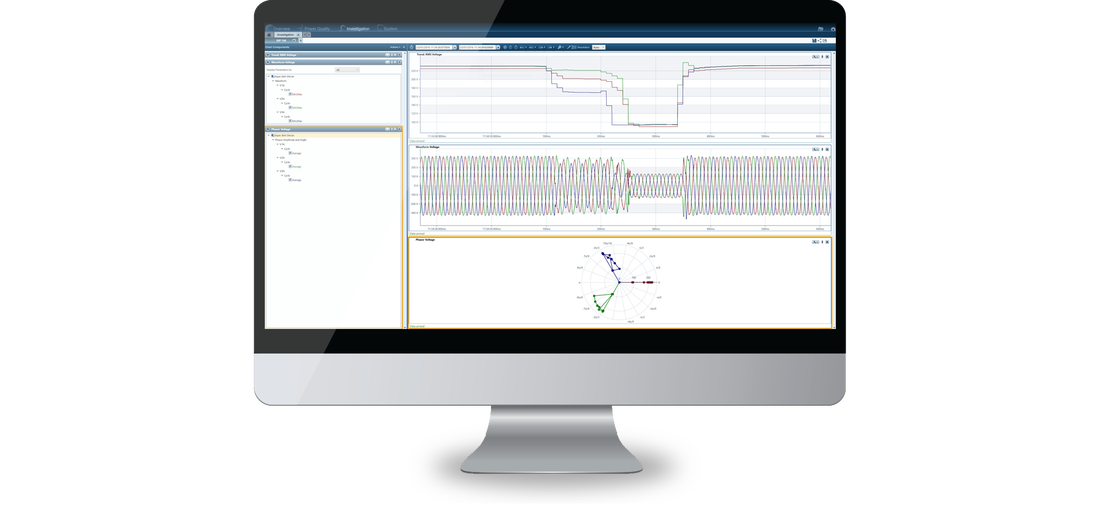
With regard to PQScada Data Visualization, the Sapphire Research Module of Electricity Parameters Research offers almost unlimited many types of diagrams from which you can choose which provides the best possible conditions for analyzing the problem.
The power module in the instant indicates the status of the total network or individual measurements in the selected points for the selected time period. The electrical quality requirements are adjustable and can be set up to fit any network. Numerous network adherence criteria can be applied at one metering point for comparison. A detailed report regarding compliance with network rules can be easily generated from the power quality module.
PQScada Sapphire allows you to view all metrics in a geographic map with real-time and general status data. In addition, the folder has 3 widgets that can display the status of the entire electrical network. The first widget refers to the quality of electricity and it shows a list of metering points that do not comply with configured network rules. The research link will be displayed and then easy to access the analysis of the event. The second widget refers to the disorder and it displays a list of previously defined events that occurred in the last hour, day, month, or year. There is also a map link enabled that provides fast and easy access to the event. The third widget is systematic and it displays system messages or alerts related to the drive state, and through the link is easy to do further research.